
1. MapWindow GIS Lite
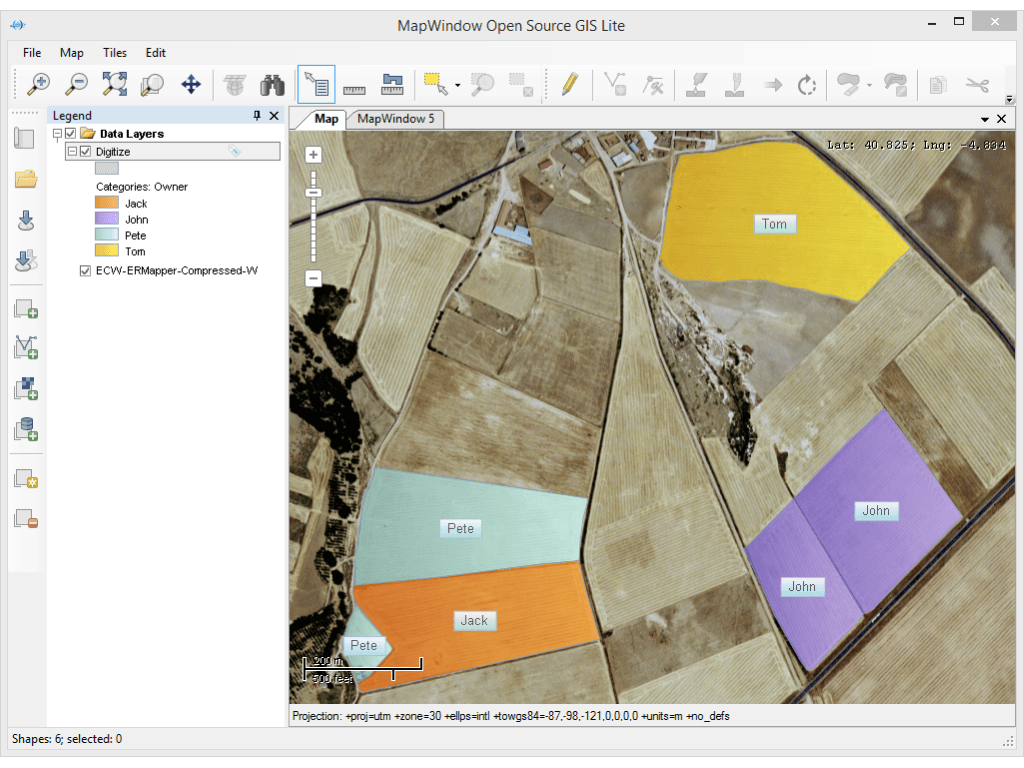
This is MapWindow Open Source GIS Lite, a demo of the MapWinGIS ActiveX control version 4.9.5. A similar custom GIS application can be built based on this app or on the barebone MapWinGIS control in a matter of days, using Visual Studio (Pro, Express or Community edition) or SharpDevelop. To showcase all the new features of MapWinGIS v4.9.5 this demo application was created.
MapWindow Lite can do some basic stuff, like opening and closing layers, show tiles, change symbology and labeling. Also new features like the new selection tool, loading data from a PostGIS database and the Shapefile Editor are added. Of course the source code is also available so you can use it to create your own application. Stability has been improved, making this version of MapWinGIS more stable and faster than ever. MapWinGIS v4.9.5 and thus MapWindow Lite use GDAL v2.0.
The development of this project depends on public donations. Our plans include further development of MapWinGIS core library and also releasing a new version of MapWindow desktop GIS based on it, which will be called MapWindow 5. This lite version can be considered the first version of it. More info about our future plans can be found here: http://www.mapwindow.org/documentation/mapwindow5/index2.html
MapWindow Lite is available for free download as a single ready-to-install .exe file from the MapWindow CodePlex website: https://mapwindow4.codeplex.com/releases/view/542097. MapWindow is a native Windows application that requires installation of the Microsoft .NET framework v4. It runs on XP, Vista, Windows 7 and Windows 8 and works fine on 64-bit machines. The program is quite intuitive to use and new users will be up and running quickly. With only a couple of exceptions it provides a user experience that meets or exceeds that of ArcMap.
The MapWindow Lite desktop program that is the focus of this guide is just one part of a larger Open Source project. The core software is also available as an ActiveX component (called MapWinGIS, download it at https://mapwingis.codeplex.com/releases), allowing programmers to develop customized GIS applications. It is also possible for advanced users to modify and extend the desktop program to fit individual needs. More information on the MapWindow project and its various facets can be obtained from the MapWindow website: http://www.mapwindow.org/
2. Getting Started
2.1 Projects
The project file maintains a record of the different layers, labels, colors and styles you have defined for your map. When MapWindow starts it loads the last opened project. You can also start a new project at any time by clicking the New project toolbar button. Any changes that you make to a project are not stored until you click the Save project toolbar button, or save when prompted on exit. Previous projects are accessed by clicking the Load project toolbar button or selecting File from the top menu and clicking Load Project. Project files carry the extension .mwprj.
Besides saving the layers and related symbology the project file stores a few additional settings such as map units, projections, and so on. Users will generally not have to make any changes to these settings so they will not be discussed here.
2.2 Plug-ins
MapWindow Open Source GIS v4.8.8 has a plug-in architecture. This architecture is not available in this Lite version, so we will not discuss it here. With the upcoming version 5, the plug-in architecture will return but in a more modern capacity. We will use the Managed Extensibility Framework, making it more easy and flexible to create and maintain plug-ins.
2.3 Adding data layers
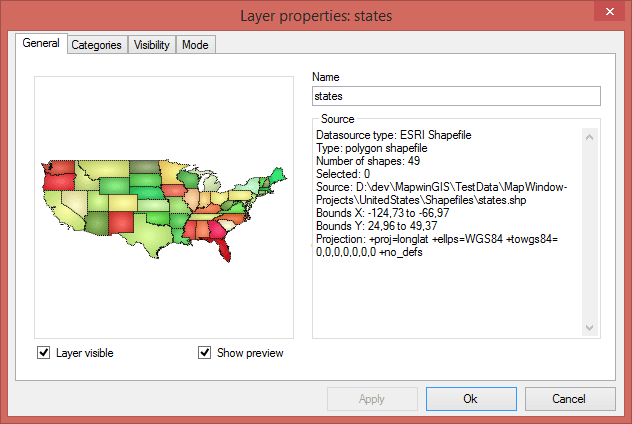
The maps you produce will usually be composed of several GIS data layers. These layers are added either by dragging and dropping files from Windows Explorer onto the map display window or by clicking the Add toolbar buttons. Each layer that is added is listed in the legend window. Double clicking the layer in the legend or right-click on the layer and select Properties will bring up the Layer properties dialog which has several tabs for making changes to a layers properties. For example, to change the name displayed in the legend select the General tab and modify the text in the Name textbox. Other properties will be dealt with in subsequent sections. To remove a map layer right-click the layer and select Remove.
The colored icons displayed in the legend illustrate the type of data in the layers (polygon, line or point) and the current symbology. The order of the layers in the legend determines the overlay order in the map: layers that are higher in the list cover layers that are lower. If a layer seems to be missing it might be because it is completely covered by other layers. To change the order of a layer just click and drag it to where you want it to go. A small checkbox beside each legend entry allow you to turn the display of individual map layers on and off.
MapWindow will display different kinds of GIS data, including: vectors (polygons, lines, and points), rasters (rectangular grids of data) and images. Many different file formats are supported, including .shp, .asc, .aux, .bgd, .bil, .dem, dt1, .hdr, .img, .jpg, .sid, .std, .tif and others. The ESRI shapefile (.shp) is the vector format used by MapWindow when generating new vector files. For grids a GeoTiff proxy image is used. In this Lite version MapWindow can also connect to a PostGIS GeoDatabase.
By default Tiles are enabled and can show tiles from a long list of providers like OpenStreetMap (default), MapQuest Aerial and Bing maps. For the latter you need a valid API key. Tiles will be warped to the projection of the map, which is determined by the first layer opened.
2.4 Projections
A projection is a mathematical transformation used to display the 3-dimensional earth onto your 2-dimensional computer screen. Different projections are available, each with its own benefits, costs, and appropriate uses. A detailed discussion of projections is beyond the scope of this guide, but a few basic points need to be covered. The main issue is that the various layers in your project all need to use the same projection if the overlays are to line up. In MapWindow, the projection of a layer is defined in a supplemental file carrying the .prj extension. This is a common format for projections, also used in ArcMap and QGis. A layers projection can be viewed in the General tab of the Layer Properties dialog, which is opened by double-clicking the layer in the legend or right-click on the layer and select Properties.
The first map that you add to a project defines the projection for the entire project. Each subsequent layer must have the same projection or MapWindow will display a warning dialog. This dialog allows you to reproject the incoming layer, or do nothing (in which case the layers may be misaligned). Note that reprojecting a layer involves more than just changing the contents of the .prj file, there are also changes to the shape of the polygons. Therefore, it is best to reproject to a new file, rather than overwriting the old.
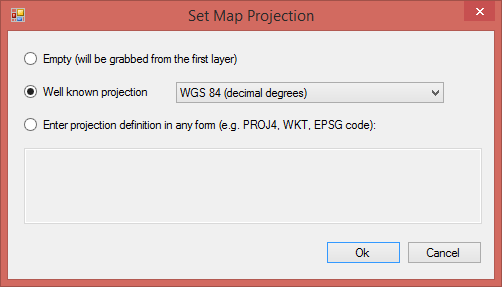
You can also set the map projection before you add any layers.
2.5 Basic toolbar functions
A suite of basic map functions is accessed through a set of toolbar buttons. Their use is quite intuitive so only a brief explanation is provided here. Note that several functions require the user to first select a target layer, which is done by clicking it in the legend. You can move the toolbars (click and drag at the dotted line). Also several keyboard shortcuts are available.

|
Start with a blank map. Shortcut ‘CTRL-N’. |

|
Load a project. Shortcut ‘CTRL-L’. |

|
Save the current project. Shortcut ‘CTRL-S’. |

|
Save the current project under a different name. |

|
Add a layer, all formats can be selected. Shortcut: ‘CTRL-O’. |

|
Add a vector layer, defaults to ESRI shapefile format. Other vector formats can be selected. |

|
Add a raster layer. Image and grid formats can be selected. |

|
Add a PostGIS layer. Fill in the connection details and select a PostGIS layer. |

|
Creates a new shapefile layer with the extent and projection of the current map. |

|
Removes the selected layer from the map. |

|
Zoom in: either click the area of interest or draw a bounding box. Zooming in and out can also be done using the mouse wheel. Shortcut: ‘z’ key. |

|
Zoom out. Shortcut: ‘z’ key, if you are already in zoom mode the ‘z’ key will toggle between zoom in and zoom out. |

|
Zoom to the full extent of all visible layers. Shortcut: ‘Home’ key. |

|
Zoom to the extent of the target layer. |

|
Click and drag the map within the display window. Shortcut: ‘Spacebar’, after release the spacebar the previous tool is selected again. |

|
Click to set the projection of the map, only enabled when no layers have been loaded yet. |

|
Click to find a location, uses OpenStreetMap Nominatim. |

|
Click to view the attributes of shapes in the target layer. |

|
After selecting this button, click on the map to measure distances. Shortcut: ‘m’ key, also toggles between distance and area. |

|
After selecting this button, click on the map to measure areas. Shortcut: ‘m’ key, also toggles between distance and area. |

|
Select shapes by rectangle from the target layer. Ctrl-click to select multiple shapes, or draw a bounding box. You can also select by hand-drawn polygon. |
3. Producing a Map for Export
3.1 Defining symbology: vectors
When you first add a layer all shapes are given the same color and outline. MapWindow can customize the symbology (color scheme, outlines, style, etc.) by using the Layer Properties dialog, which can be accessed by double-clicking the layer in the legend.
3.1.1 Unique values
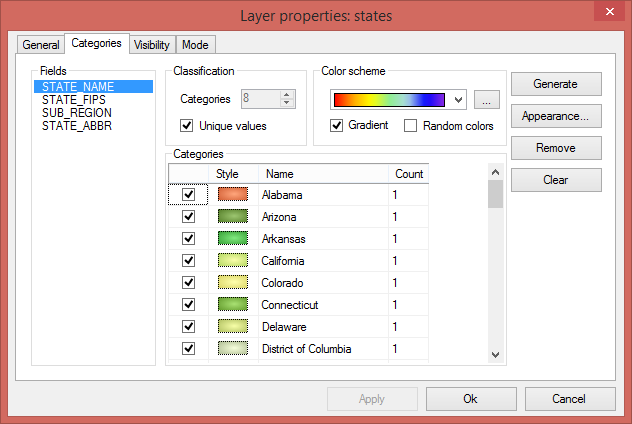
If your layer is made of shapes that represent distinct entities, say state names, then proceed as follows. Select the Categories tab of the Layer Properties dialog. It will be empty when you begin, indicating that no symbology has been defined.
- Select Unique values
- Under Fields select the attribute you want to use for assigning different colors to shapes
- Color scheme is used to select the color palette for your shapes. Click the triangle to the right to select a different palette. The option button on the far right can be used to edit the palettes and define new ones.
- If Random colors is not checked, colors are sequentially assigned from left to right across the entire palette.
- If Gradient is checked a gradient from dark to light is applied to each polygon. This effect is really only apparent when polygons are large.
- The other entries in the dialog are not used for unique values.
- Click Generate to create the categories
- Click Ok to finish and close the dialog
3.1.2 Continuous data
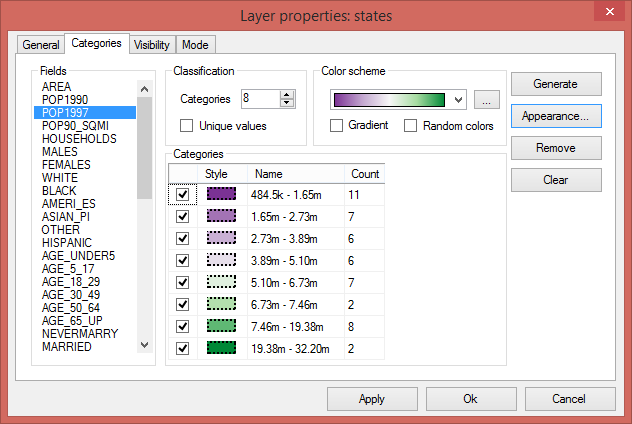
If your layer contains continuous data, say the population in 1997, then you must define categories into which the shapes are assigned. Begin by opening the Layer Properties dialog and selecting the classification field and color scheme as described in 3.1.1 Set the number of categories you want in the Categories box. Then, click Generate and click Ok to complete the process.
If you wish to display the categories using a color ramp, say light red for low values grading to dark red for high values, select a smoothly grading color palette from the list of palette options. Do not check the Set gradient option because this refers to color gradients within polygons, something else entirely.
3.3 Adding labels
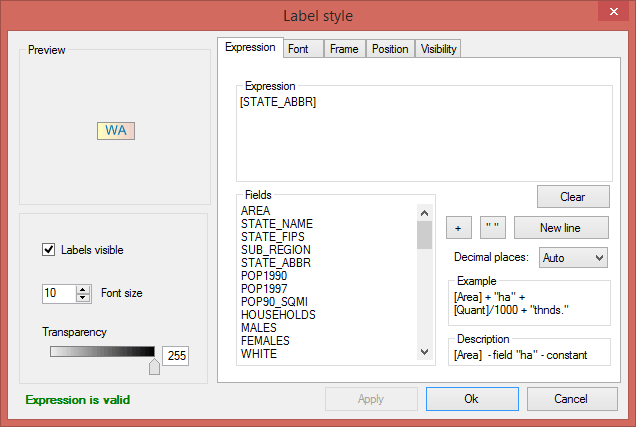
Labels are added or modified by right-click on the layer and select Labels. When you first open this dialog the label preview window will be empty. The first step is to select the attribute that holds the label values. The available attributes are listed in the Fields window. Double-click on the appropriate attribute and it will show up in the Expression window, indicating that it has been selected. Click Apply and a pop-up will ask you how you want to anchor the labels.
Next, open the Font tab and select a font. Note that the default font may not be set, so you might not see anything until you assign the font here. Click Apply and the labels will appear on your map. The Label style dialog has many other options you can use to customize your labels, but none are mandatory. These options are fairly self-explanatory. Click Ok to finish.
3.5 Exporting a map
3.5.1 Low resolution export
Open the map menu and select Snapshot. Give the name and location of the JPEG-file to be created and the layers, including the tiles will be exported to that file. The resolution of the map is equivalent to the resolution of your computer screen. This being the case, the exported maps are ok for use in PowerPoint but not for printing. Even though the map may look ok in Microsoft Word when its up on your screen, the image quality on paper will be poor.
3.5.2 Preparing a publication-quality map
This option is not available in this Lite version, but will be back in MapWindow Open Source GIS v5.
4. Advanced Topics
4.1 The attribute table
This option is not available in this Lite version, but will be back in MapWindow Open Source GIS v5. This lite version does have a simple identify tool which will show the attributes of the selected shape.
4.2 Selections
The advanced selection option is not available in this Lite version, but will be back in MapWindow Open Source GIS v5.
4.3 Creating and editing shapefiles
The shapefile editor is newly introduced in this Lite version. In older version was a sepearate plug-in for MapWindow, now the editor is in MapWinGIS, the mapping engine. This makes the editor much more stable and responsive. It can also handle much larger vector data.
The editor toolbar has several buttons which will be briefly explained below:

|
Start editing the shapefile. |

|
Save your changes to the shapefile. |

|
Draw a new shape. |

|
Vertex editor. Add, delete or move nodes. |

|
Merge the selected shapes. |

|
Split the selected shape. |

|
Move the selected shape |

|
Rotate the selected shape. |

|
Erase, clip or split by polygon |

|
Split by polyline |

|
Copy the selected shape. |

|
Cut the selected shape. |

|
Paste a new shape. |

|
Undo last action. |

|
Redo last action. |
4.3.1 Creating a new shapefile
Shapefiles are created using the Create layer toolbar button. Clicking it brings up a dialog in which you specify the name and location for the new file. You also select which type of shape you want: point, line, or polygon. Before creating a new shapefile you should load a layer into your project to set the projection and to serve as a spatial reference when adding your new shapes. Advanced techniques for georeferencing are beyond the scope of this guide.
When a shapefile is created it is empty. To add freeform shapes use the Add shape toolbar button. While using the mouse each time you left-click a new vertex is added. When all the vertices have been defined, right-click the mouse and select Finish operation to finish. The context menu has more options, like Undo point to remove the last point, this can be done until all points are removed again, Snapping to snap the current layer, all layers or no snapping, Highlighting to highlight the current layer, all layers or no highlighting, Cancel to remove the shape you are drawing without saving it.
4.3.2 Modifying existing shapes
The shapefile toolbar has a Vertex editor button for changing the shape of existing shapes. Vertices will be visible when using the vertex editor. When your click on the shape you want to edit it becomes semi-transparent and the vertices will be clickable. When you click on a vertex (its color changes from blue to red) you can drag it to another location. When you double-click on the line a new vertex will be added. When you select a vertex and hit the delete button on your keyboard it will be deleted (after confirmation). This shapefile editor comes with an undo/redo option. Using the associated buttons on the toolbar you can undo/redo actions. The changes won’t be saved to disk until save the changes using the Save changes button in the editor toolbar.
4.4 Geoprocessing
This option is not available in this Lite version, but will be back in MapWindow Open Source GIS v5.