
TileMill Quickstart
TileMill is a tool to quickly and easily design maps for the web using custom data. It is built on the powerful open-source map rendering library Mapnik ( the same software OpenStreetMap and MapQuest use to make some of their maps ) and uses CartoCSS as a stylesheet language.
This Quick Start describes how to:
- Add layers from a PostGIS connection
- Customize styles
- Configure Tooltips
- Write a legend
- Export maps
Contents
Create a project
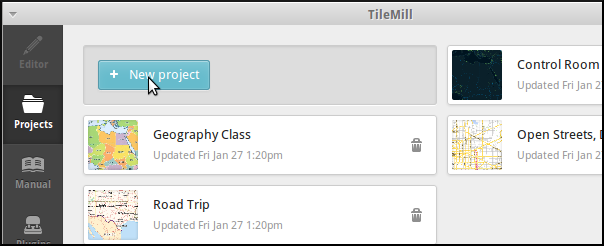
- Start TileMill and click on the “New project” button on the main screen.
2- Enter de following data in the form, and click “Add”:
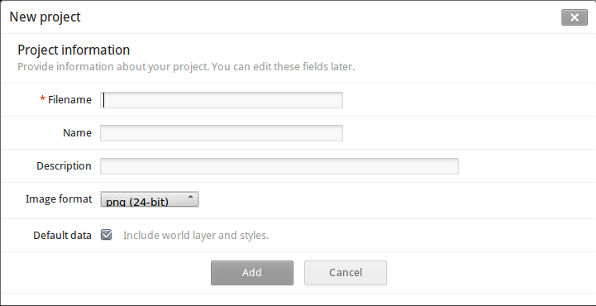
Filename: tilemill_quickstart
Name: TileMill Quickstart OSGeo Live
Description: Quickstart from OSGeo Live
Default Data: Leave selected
- Click on the new project to open it. The project contains a default layer called #countries styled with some example CartoCSS code.
Add new layers to the project
We can add new layers from File, SQLite or PostGIS. Let’s say we want to add layers from OSM data stored in PostGIS. In this tutorial we assume that we already know the tables, fields and types of data we want to represent in the map. We can do this previous analysis either querying PostGIS directly using pgAdminIII, or by means of any desktop GIS with PostGIS connection, like QGIS or Open Jump.
- As are going to add layers from PostGis data. First, we click on layer button (
 ) and press on ‘+ Add layer’ button. In the ‘Add layer’ form, we first select the source data type, PostGIS:
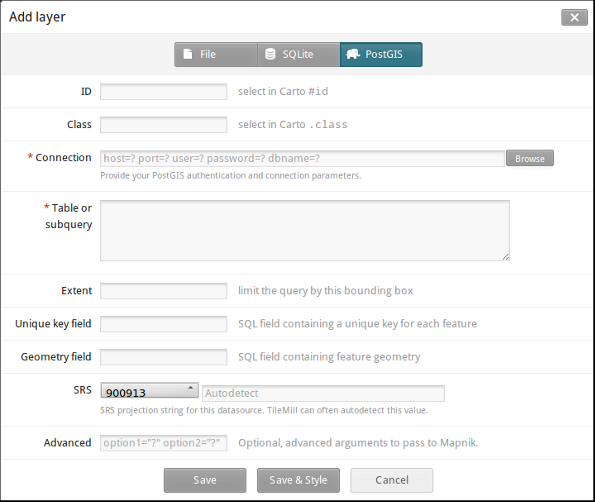
- Add roads layer from PostGIS, given the following data, and click on ‘Save & Style’:
ID: osm_roads
Class: osmroads
Connection: host=localhost port=5432 user=user password=user dbname=osm_local
Table or subquery: planet_osm_roads
Unique key field: osm_id
Geometry field: way
SRS: Select WGS84
- Add a lines layer from PostGIS, given the following data, and click on ‘Save & Style’:Click on ‘Save & Style’:
ID: osm_line
Class: osmline
Connection: host=localhost port=5432 user=user password=user dbname=osm_local
Table or subquery: planet_osm_line
Unique key field: osm_id
Geometry field: way
SRS: Select WGS84
- Add a points layer from PostGIS, given the following data, and click on ‘Save & Style’:
ID: osm_points
Class: osmpoints
Connection: host=localhost port=5432 user=user password=user dbname=osm_local
Table or subquery: (select osm_id, amenity, way from planet_osm_point where amenity is not null) AS amen
Unique key field: osm_id
Geometry field: way
SRS: Select WGS84
In the osm_points layer we are importing a subset of points of the table planet_osm_point table in osm_local dataset, considering only those points with not empty amenity value.
Set default visualization for the project
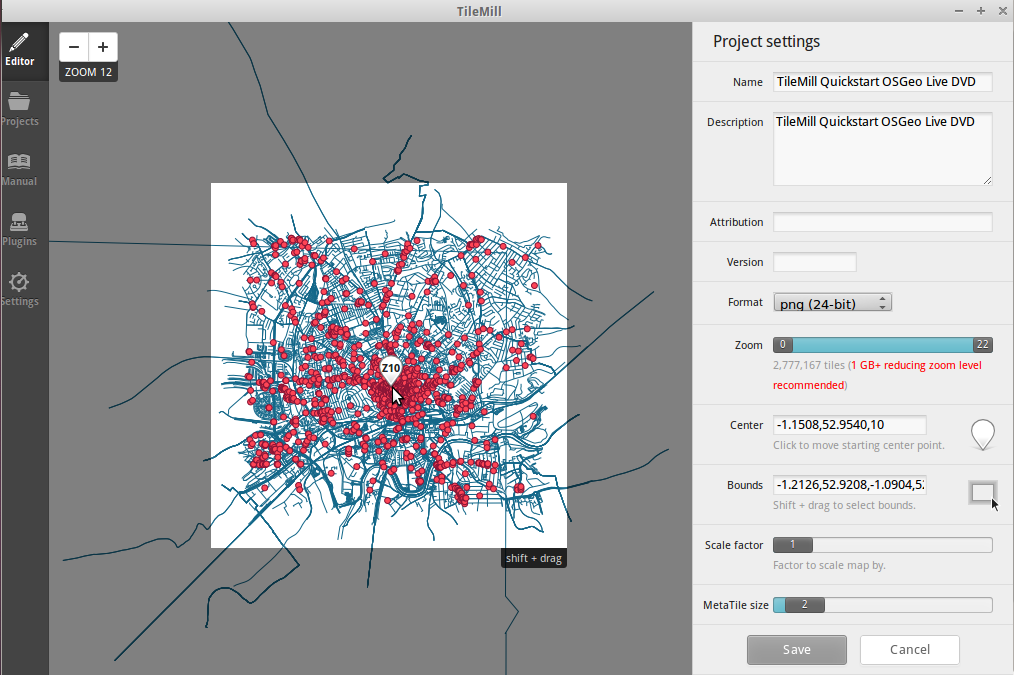
In order to set the dafault values for the working area, click on  buttom. Now you can center the working area, and set the center point. You can also type the center and bounds values directly in the form.
Styling data
TileMill uses a language called CartoCSS to determine the look of a map. Colors, sizes, and shapes can all be manipulated by applying their relative CartoCS parameters in the stylesheet panel to the right of the map. Read the CartoCSS manual for a more detailed introduction to the language. As new PostGIS layers have been imported using “Save&Style” button, they have automatically been added several styling parameters to your stylesheet and gave them an initial value:
- #osm_point
This is the layer to which the styles are applied.
- marker-width
This determines the size of the markers, in pixels. You can experiment with changing this by typing in a different number.
- marker-fill
This is the color of the inside of the marker. There are two methods for changing color values. You can either type in a new value, or you can use the color swatches at the bottom of the CartoCSS panel
- marker-line-color
This is the color of the border of the marker.
- 5.- marker-allow-overlap
- This allows markers to be placed on top of each other. If this is not specified or set to false, potentially overlapping markers will not be displayed.
Any of this values can be changed and visualized after saving the project.
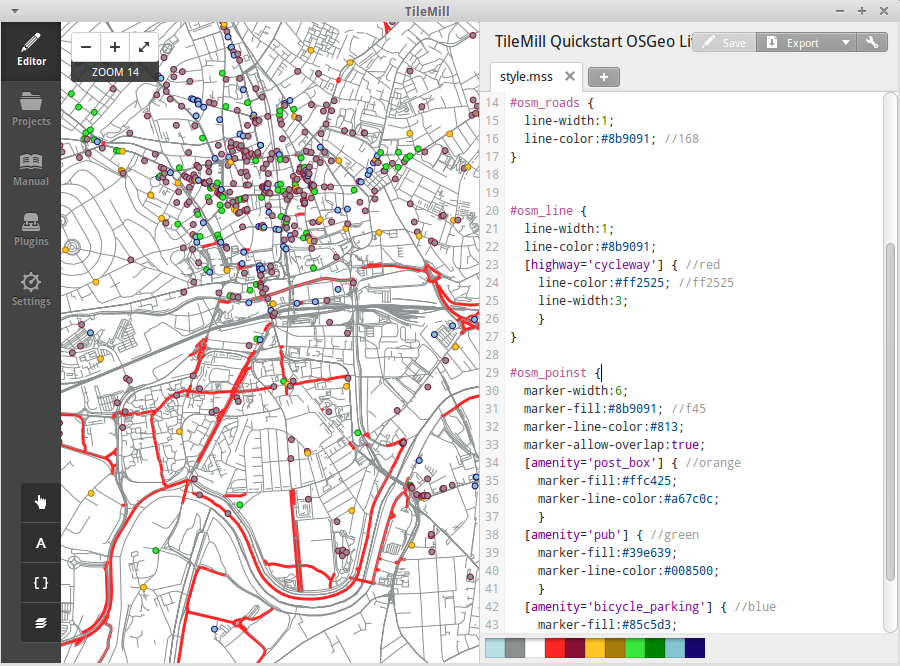
Conditional styles
Conditional CartoCSS styles allow you to change the appearance of the features on your map, based on data attributes. Here we will customize osm_points and osm_roads, in order to highlight some types of feature, given certain values. We will apply different styles to points depending on whether they represent ‘post_box’, ‘pub’or ‘bicyle_parking’, as we know in advance that those are given values in the field ‘amenity’ of the table. We will define a different style to lines that represent ‘cycleway’, as we know in advance that ‘cycleway’ is a given value in the field ‘highway’ of the table. This is our code after changing certain style values and coding some conditional styles:
Map {
  background-color: #b8dee6;
}

#countries {
  ::outline {
    line-color: #8b9091;
    line-width: 2;
    line-join: round;
  }
  polygon-fill: #fff;
}

#osm_roads {
  line-width:1;
  line-color:#8b9091; //168
}


#osm_line {
  line-width:1;
  line-color:#8b9091;
  [highway='cycleway'] { //red
    line-color:#ff2525; //ff2525
    line-width:3;
    }
}

#osm_poinst {
  marker-width:6;
  marker-fill:#8b9091; //f45
  marker-line-color:#813;
  marker-allow-overlap:true;
  [amenity='post_box'] { //orange
    marker-fill:#ffc425;
    marker-line-color:#a67c0c;
    }
  [amenity='pub'] { //green
    marker-fill:#39e639;
    marker-line-color:#008500;
    }
  [amenity='bicycle_parking'] { //blue
    marker-fill:#85c5d3;
    marker-line-color:#180773;
    }
}
Tooltips
Tooltips allow you to make maps interactive with dynamic content that appears when a user hovers over or clicks on a map. They can contain HTML and are useful for revealing additional data, images, and other content.
1. Open the Templates panel by clicking on the pointer button on the bottom left (  )
)
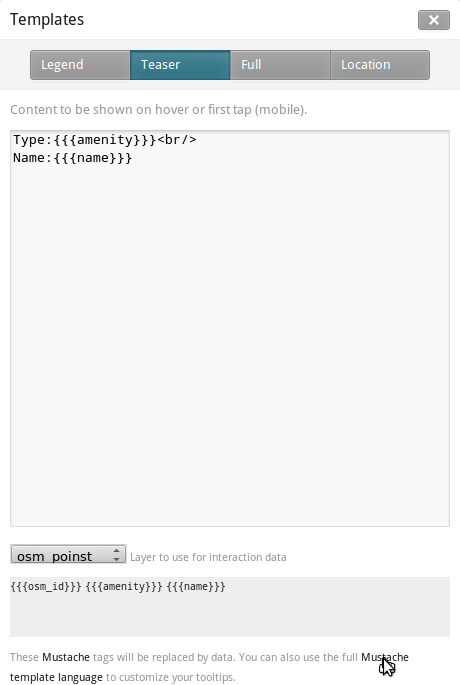
- Click on the “Teaser” tab. Teaser content appears when you hover over a feature and Full content appears when you click on a feature. You can use the Location field to define a URL to be loaded when a feature is clicked.
- Select the ‘osm_point’ layer to use it for interaction. TileMill only supports one interactive layer at a time.
- The data fields for the layer are displayed wrapped in curly Mustache tags. These tags will be replaced by data when you interact with the map. Locate the fields you want to use.
- Write your template using the Mustache tags. Paste the following code into the Teaser field and use the preview to make sure it looks good:
Type:{{{amenity}}}<br/>
Name:{{{name}}}
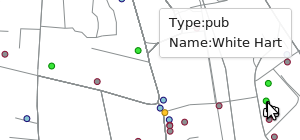
- Click “Save” to save your settings and refresh the map. Close the panel by clicking the close button (X) or by pressing the ESC key. Move your mouse over some points to see the tooltips.
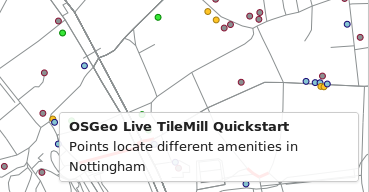
Legends
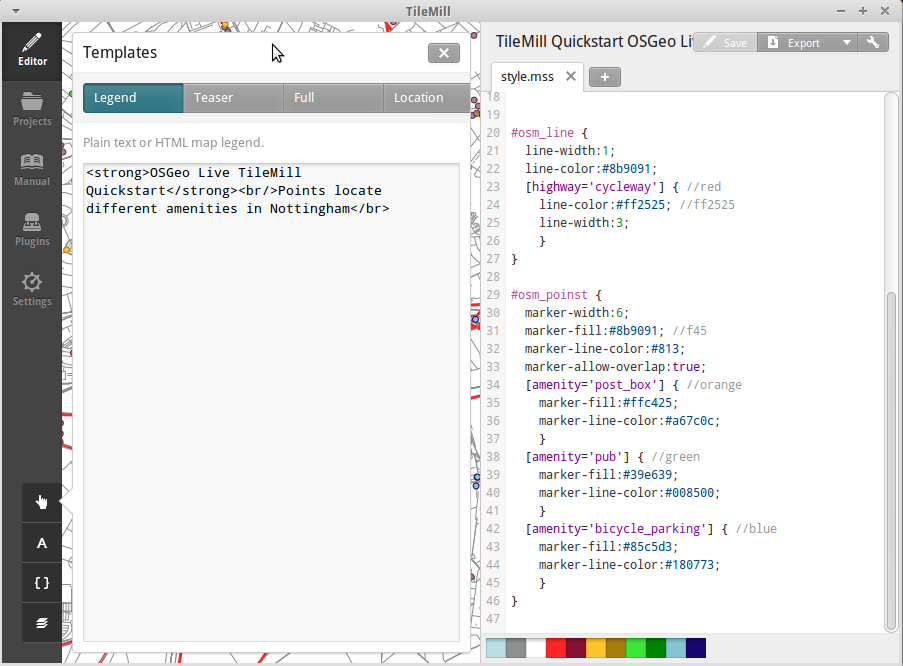
A legend is permanently on a map and is useful for displaying titles, descriptions, and keys for what is being mapped. It can be styled using HTML, or it can simply contain an image.
Let’s add a legend that describes the theme of the map.
- Open the Templates panel by clicking on the pointer button in the bottom left
- The Legend tab is open by default.
- Enter your legend text/html in the Legend field:
<strong>OSGeo Live TileMill Quick Start</strong><br/>Points locate different amenities in Nottingham</br>
- Click save and close the panel. You will now see your legend in the bottom right corner of the map.
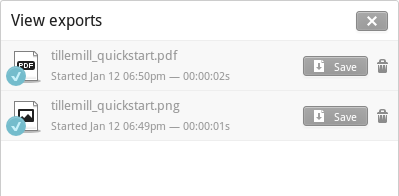
Exporting the map
TileMill can export maps to MBTiles, PNG, PDF, SVG, or Mapnik XML formats. A full listing and overview is in the Exporting documentation
If you want to export to MBTiles:
- Click the “Export” button. A drop down menu will appear.
- Click “MBTiles”. The window will transition to the export tool.
- Choose a “Filename”“. The name of the project will be placed here by default.
- Select Zoom levels. Set the furthest zoom to 1 by dragging the left end to the right. Set the closest zoom to 6 by dragging the right end to the left.
- Select the “Center” of the map. This determines the starting center and zoom level of the map when it is first loaded. You can manually enter these values or click a point in the map preview. Zoom to level three and click the center of the United States.
- Select the map “Bounds”. This is the area of the map to be exported. By default the entire world is selected. If your map is allocated to a smaller region of the globe, you can save processing time and disk space by cropping to that area. This can be done by manually entering values in the Bounds fields, or by holding the SHIFT key and clicking and dragging on the map. Leave the default value.
- Click “Export”.
- When the export process is complete, the progress bar will be replaced by a Save button. This will save a copy of the file locally to a specified location.
You can return to the Welcome view at any time by selecting the from the menu bar.
Things to Try
Here are some additional challenges for you to try:
- Try changing fixed or conditional styles on your own
- Try importing data from other sources, like .CSV file or sqlite ( You can follow on-line TileMill crashcourse documentation)
What Next?
This is only the first step on the road to using TileMill. There is a lot more great material (and ability) left for you to discover:
- Get more help from the environment, click on help button (
 )
)
- Learn more about cartocss language on API Documentation
- Learn how to run TileMill as an Ubuntu Service