
MapServer is an Open Source server based application that allows you to publish geographic map images and vector data through to internet using OGC standards such as WMS and WFS.
This Quick Start describes how to:
Note
What will I learn ? In this section, you will learn what is a mapfile and how to configure it to allow MapServer to serve a shapefile as images using a WMS request.
The Mapfile is the configuration file that MapServer use to render geospacial data as images or vector data. Its main purpose is to list the layers it can draw, how to read them and how to draw them.
Put the following content in it:
MAP
  NAME "MAPSERVER QUICKSTART"
  STATUS ON
  EXTENT -137 29 -53 88
  UNITS DD
  SHAPEPATH "/home/user/data/natural_earth/"
  SIZE 800 600

  PROJECTION
    "init=epsg:4326"
  END

  OUTPUTFORMAT
    NAME 'AGG/PNG'
    DRIVER AGG/PNG
  END

  LAYER
    NAME "Admin Countries"
    STATUS ON
    TYPE POLYGON
    DATA "10m_admin_0_countries"
    CLASS
      STYLE
        COLOR 246 241 223
        OUTLINECOLOR 0 0 0
      END
    END
  END

END
Note
The example uses the natural earth dataset, which is already installed on the live dvd: ~/data/natural_earth (a short cut to /usr/local/share/data/natural_earth)
Each object in a mapfile start by its name (for example MAP) and ends with an END. A mapfile always start with the MAP object and should contains a list of LAYER objects the mapfile can read and draw. In our mapfile, we currently have only one layer.
Note
A complete list of the available objects and properties a Mapfile can have can be found in the MapServer documentation page.
Note
What will I learn ? You will learn how to use to render an image with layers from a mapfile with MapServer using an OGC WMS request.
Open the web browser and enter the following URL:
http://localhost/cgi-bin/mapserv?map=/home/user/mapserver_quickstart.map&SERVICE=WMS&REQUEST=Getmap&VERSION=1.1.1&LAYERS=Admin%20Countries&SRS=EPSG:4326&BBOX=-137,29,-53,88&FORMAT=AGG/PNG&WIDTH=800&HEIGHT=600
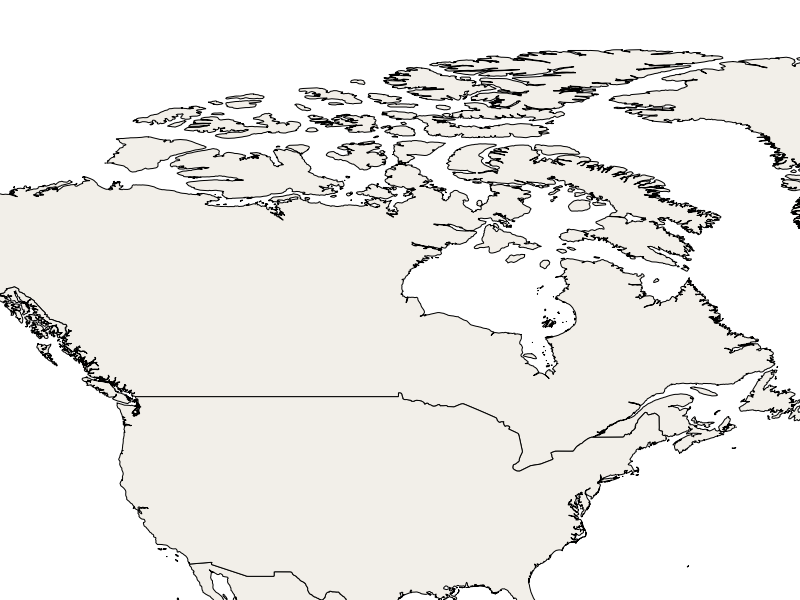
What does the above mean ? If we put it in simple words, it’s a Web Map Service (WMS) GetMap request that tells mapserver to “use the following mapfile to render the specified layers as a png image with some determined parameters such as the size of the image, the geographical extent, the projection, etc.“. All layers specified in the “&LAYERS=...” property having STATUS ON in the mapfile in addition to all layers with STATUS DEFAULT will be rendered. The result should look like the following :
Note
All parameters of the reqest are WMS-specific, except “?map=/home/user/mapserver_quickstart.map“, which is MapServer-specific.
Note
What will I learn ? You will learn how to add a new layer object definition to your mapfile.
We will now add a new layer to our mapfile. Before last END statement in the mapfile, add the following layer configuration:
LAYER
  NAME "Lakes"
  STATUS ON
  TYPE POLYGON
  DATA "10m_lakes"
  CLASS
    STYLE
      COLOR 153 179 204
    END
  END
 END
Now we have 2 layer definitions in our MapFile. Note that this new one we just added has the “STATUS ON” property. That means that unless we specifically require for it, it won’t be rendered.
Let’s take our previous WMS GetMap request as it was. Let’s say we want to add our new “Lakes” layer to the image rendered. We simply need to add its name to the “LAYERS” property list, as such:
http://localhost/cgi-bin/mapserv?map=/home/user/mapserver_quickstart.map&SERVICE=WMS&REQUEST=Getmap&VERSION=1.1.1&LAYERS=Admin%20Countries,Lakes&SRS=EPSG:4326&BBOX=-137,29,-53,88&FORMAT=AGG/PNG&WIDTH=800&HEIGHT=600
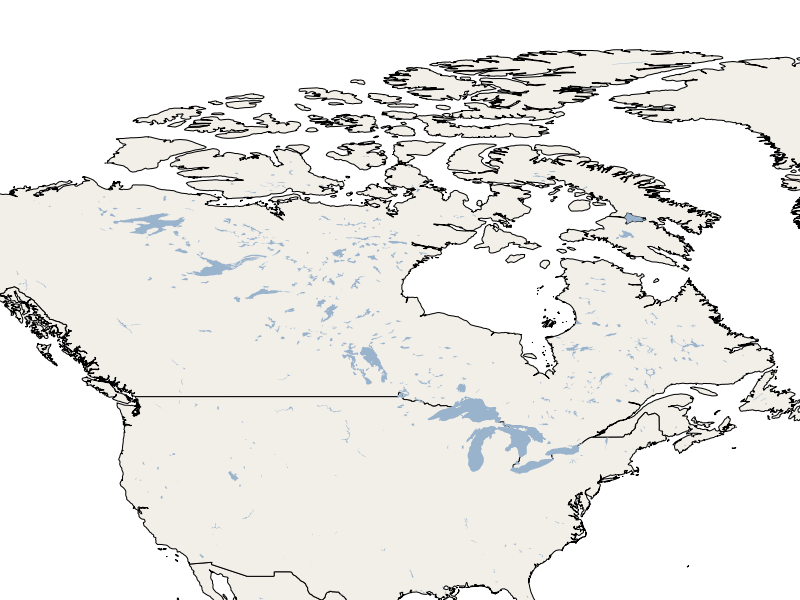
The image rendered by MapServer look like our previous map, but with addition of the lakes from our new layer:
Note
What will I learn ? You will see an example of styling elements inside a layer depending on some of its data properties.
In a MapFile, a LAYER object can contain an infinite number of CLASS object. These are used to style the elements contained in the spacial data file (DATA). For example, if we look closer at our “10m_lakes” data file using a tool such as ogrinfo, we’ll see the geometry and attribute definitions it contains. These attribute values can be used as a way to drawn the elements inside a dataset differently using multiple CLASS objects.
In our “10m_lakes” dataset, we have a ScaleRank attribute, which seems to be related ot the size of the lake. We can use this as a way to render the lakes differently. In the LAYER object, we’ll add an other CLASS object just before our current one, as such:
LAYER
 NAME "Lakes"
 STATUS DEFAULT
 TYPE POLYGON
 DATA "10m_lakes"
 CLASSITEM "ScaleRank"
 CLASS
   EXPRESSION /0|1/
   STYLE
     COLOR 153 179 204
     OUTLINECOLOR 0 0 0
   END
 END
 CLASS
   STYLE
     COLOR 153 179 204
   END
 END

END
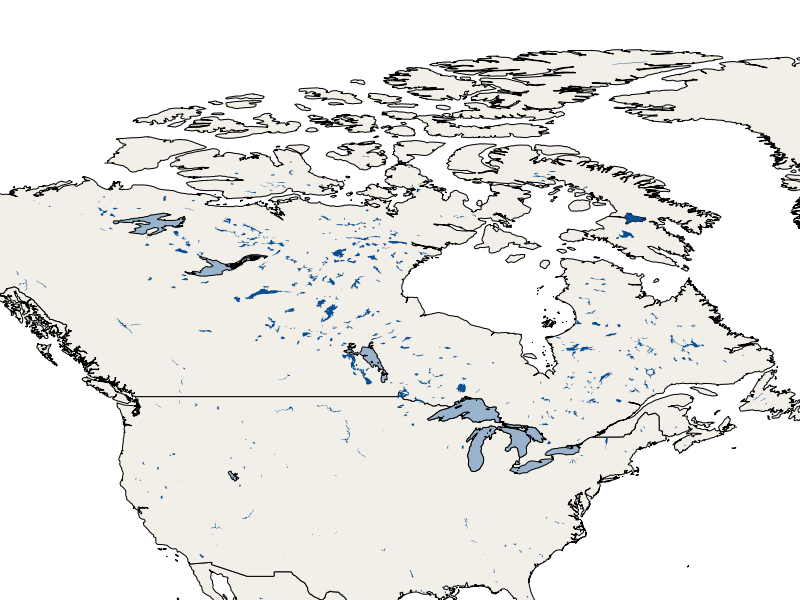
What does our new CLASS object do ? It’s basically says to MapServer to draw the elements having the “ScaleRank” property equal to “0” or “1” with a black outline. Class objects are always read from the top to the bottom for each feature to draw. When a feature respect the “EXPRESSION” specified in a class, it’s used to render the feature and we get to the other and so on. The LAYER “CLASSITEM” property tells which attribute to use with the EXPRESSION defined in the CLASS objects.
The result of this new addition should make the big lakes in our map image render with a black outline, as such:
Note
Learn more about the Expressions in MapServer.
This is a small step for you, but a more giant step still awaits. You have lots of great knowledge materials available on our website which will help you improve your abilities and skills in the Web mapping world. Here’s a few things you could do next: