GeoMoose is a GIS data portal management framework. The installed version of GeoMoose on the Live DVD is an example configuration that displays an example set of layers.
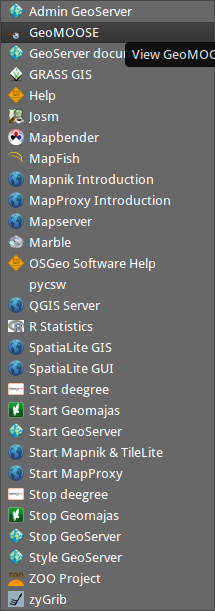
Go to the “Browser Clients” folder on the desktop.
Click on the desktop icon “Start GeoMoose”. This will launch the Default browser which will navigate to the correct location automatically.
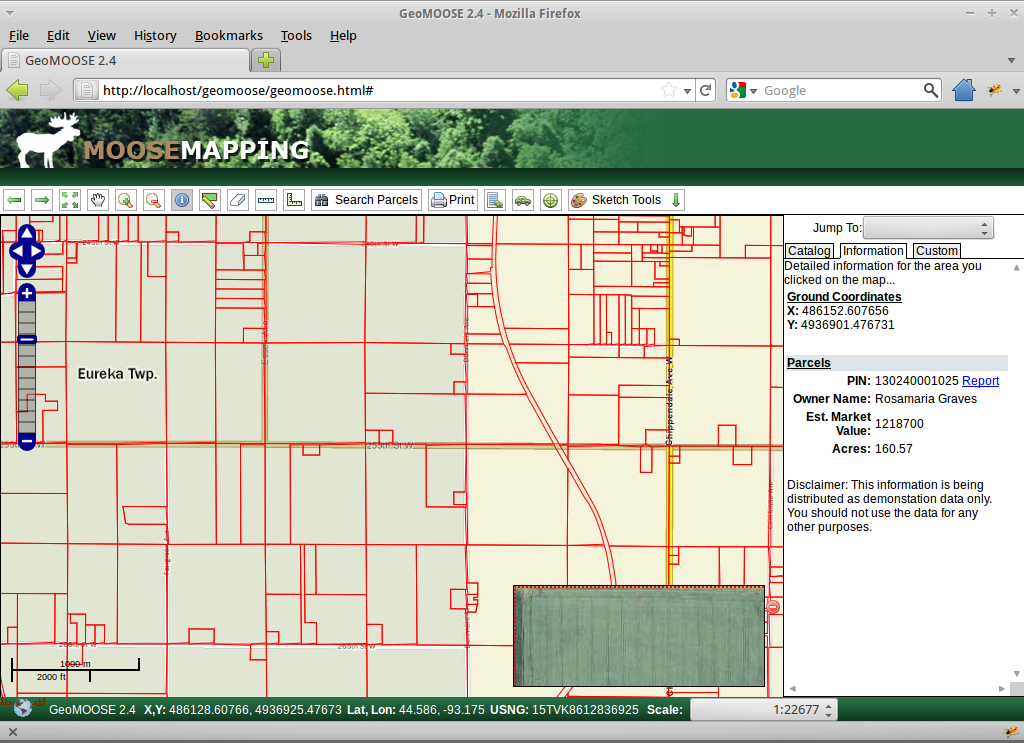
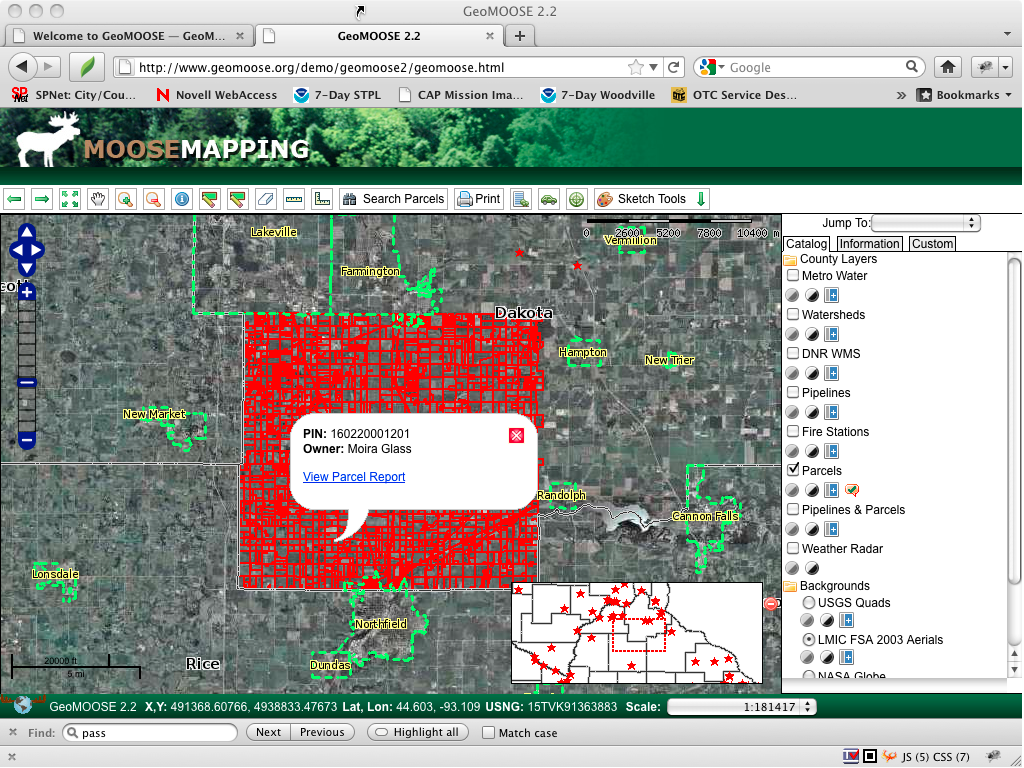
You will be presented with a web page displaying a demo interface of a GeoMoose instance.
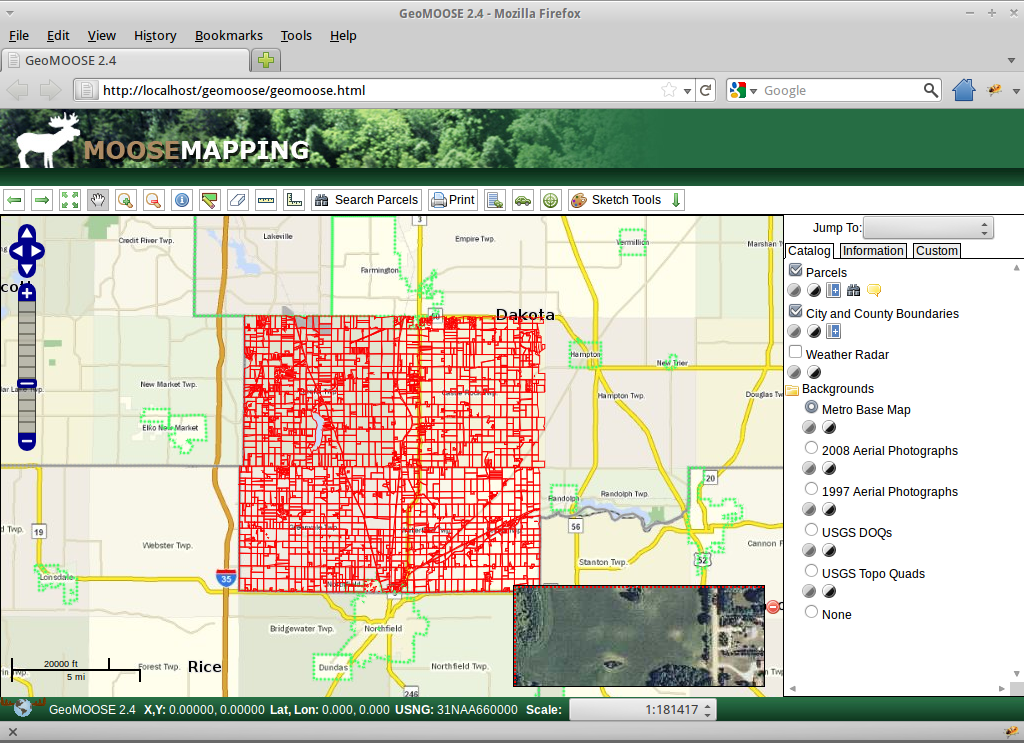
The Interfaces presented above shows:
- A banner bar
- A tool bar
- A map window with
- A navigation and zoom controls
- An Inset map
- A side menu with:
- A “Jump to” location pull down list
- A set of control tabs for: displaying the layer, or “Catalog” list, an “Information” readout, and a “Custom” output tab.
- A Footer bar with:
- Multiple coordinate readouts, one each for: X,Y (local dataset coordinates), LAT/LON (Decimal) and United States National Grid (USNG)
- A editable pull down list for a view scales to choose from or define.
You can ID a location in the interface by clicking on the “identify”, (“i” in a blue circle icon) button in the top toolbar, and then clicking a point on the map to identify.
The menu along the right side of the Map view will display a report related to the point that you clicked in the map. This is a service in the GeoMoose Demo package that has been configured to respond to quereies for the “Parcel” layer when a point is clicked.
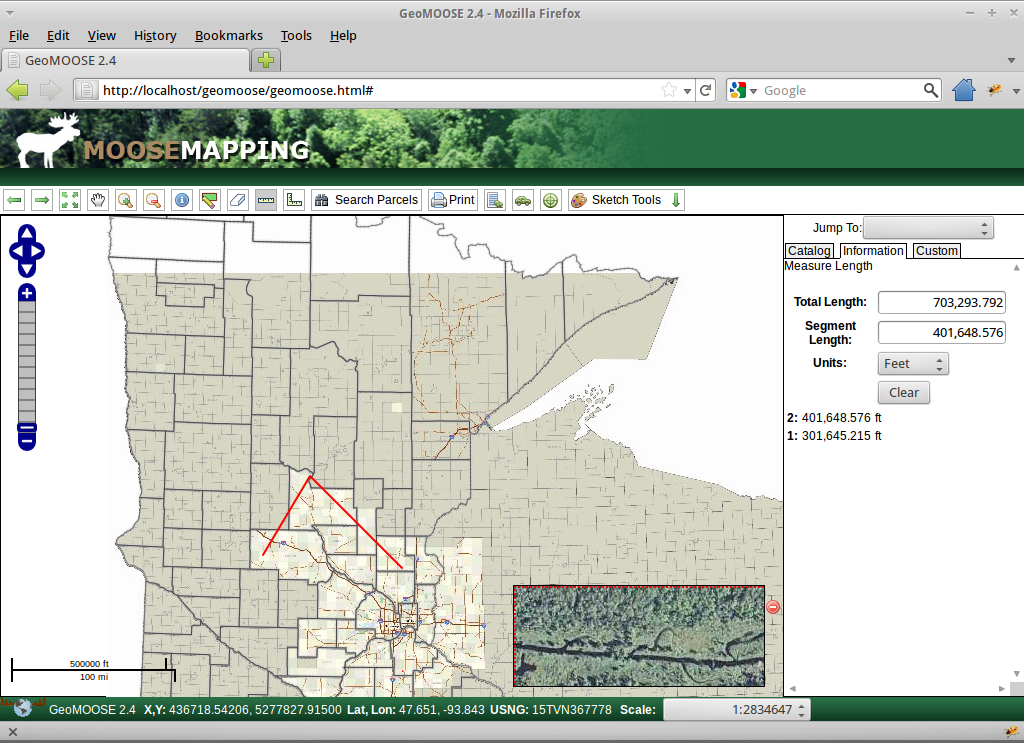
GeoMoose has some measuring tools installed and activated by default. Clicking the ruler icon in the top toolbar, will start the linear measuring tool. You can click as many points as you like in the map window and a trailing polyline will be drawn. When you get to your last point, just double click to stop. The total distance of all lines drawn will be used to generate the “Total Length” in the units of your choice in the side menu.
These user tools are considered services by the GeoMoose interface and can be added to via GeoMoose’s MAPBOOK control file.
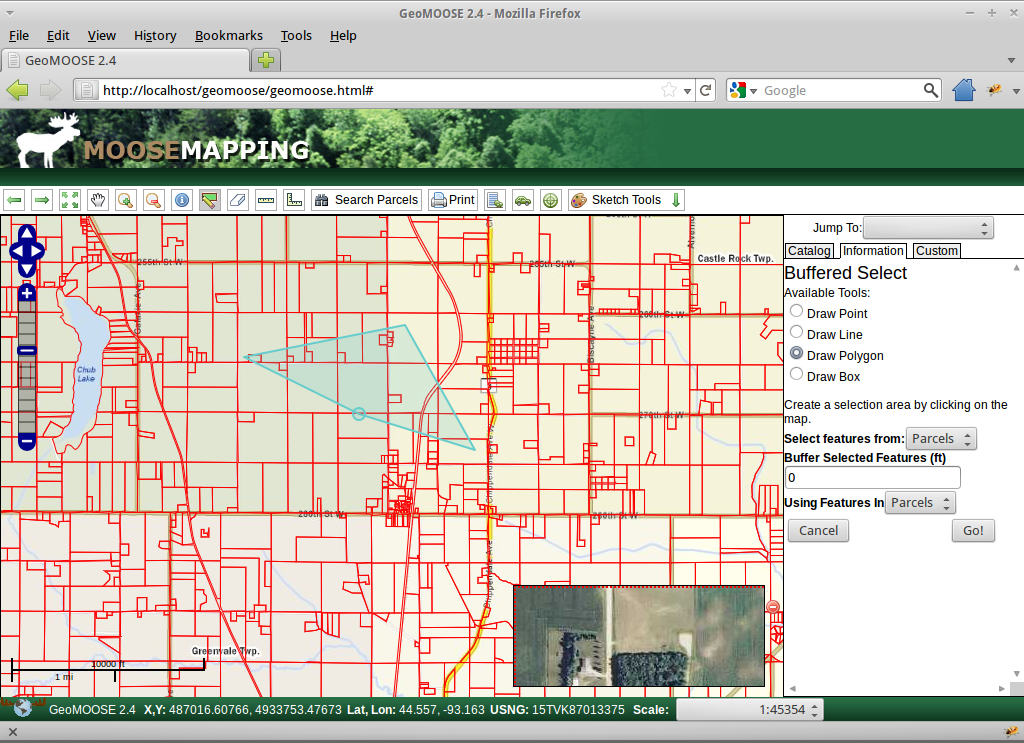
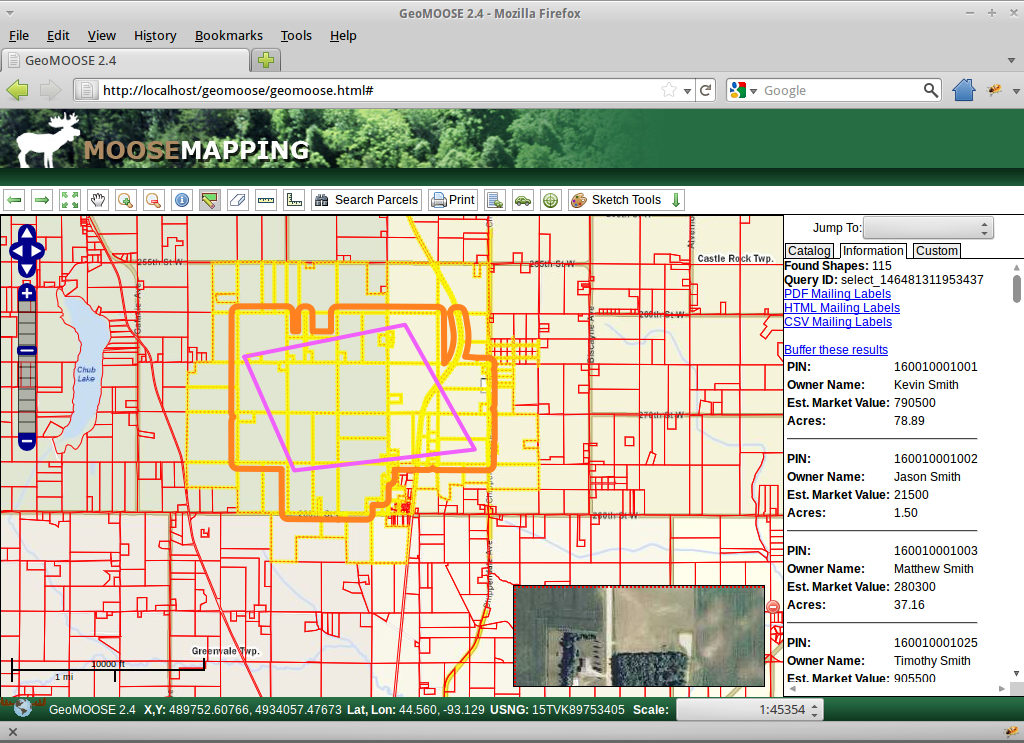
You can make a buffered selection from a Point, Line, polygon, or a Box. To start click on the “Buffered Select” icon (polygon with pencil), and start drawing a selection polygon in the map. You can double click the last point to finish the drawing process. This screenshot shows the drawing process on the map. the right menu is displaying the input form for the criteria of the buffered select, in this case a Polygon against the “Parcels” layers with a “0” value for the buffering distance.
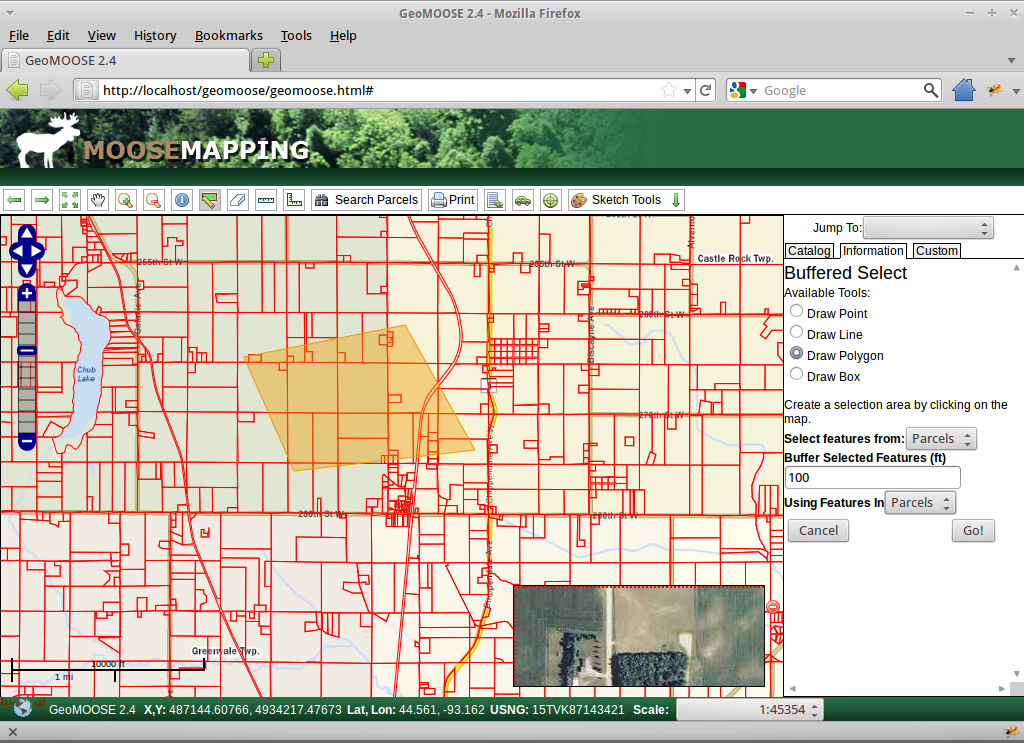
The above screenshot is showing the “PARCEL” layer for selects and also using the “Parcels” layer as the attributes to report back on. Two different layers can be used in a double pass query, one for the selection, and one for retrieving the attributes from for reporting. The sceenshot below takes the selection process further by adding in a buffering distance of 100ft.
Clicking the “Go” button in the side menu in the above screenshot will generate a report and display it in the side menu. NOTE: The output can also be configured to be sent to a new window as well.
The results above demonstrate the service response to the buffered query by displaying the result in the map via a selection overlay that highlights the original selection areas polygon (purple), the crossing and within parcels at a 100ft buffer (orange) and the parcels crossing and within the buffered polygon (yellow). The side menu now displays the reported results of the query process with options for outputting in other formats for mailing labels.
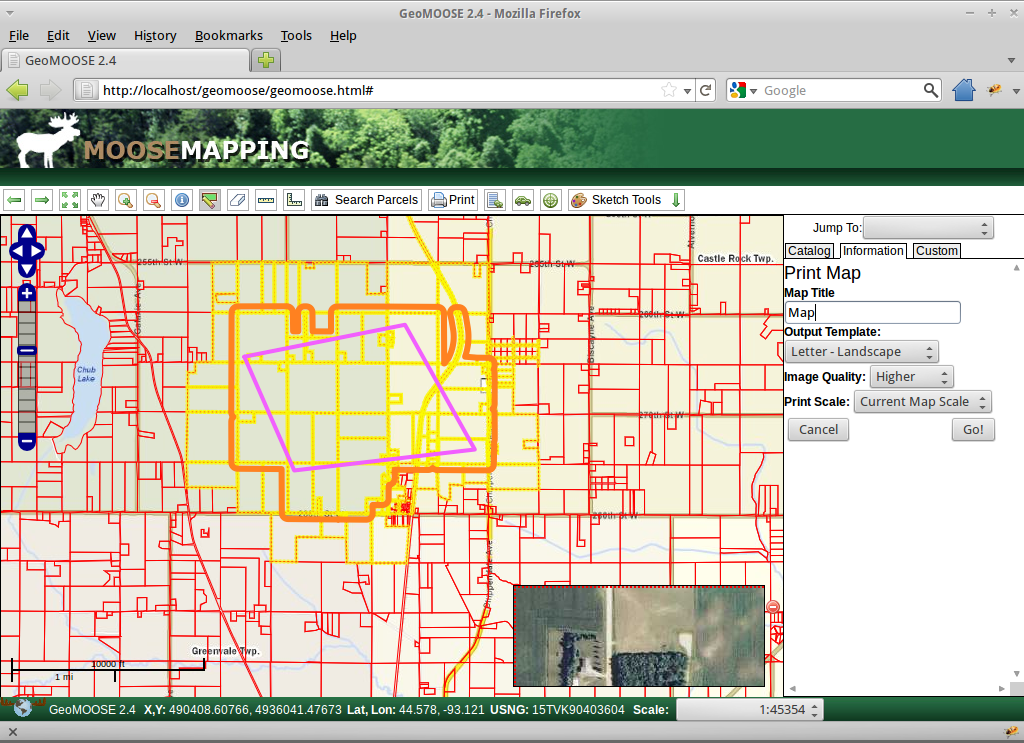
This next screenshot shows what the Print Map service might look like which is bundled with GeoMoose. the side menu in the following view, shows the options available for printing the current mapview. Sheet size, orientation, resolution for both raster image backgrounds and for overall output are also available.
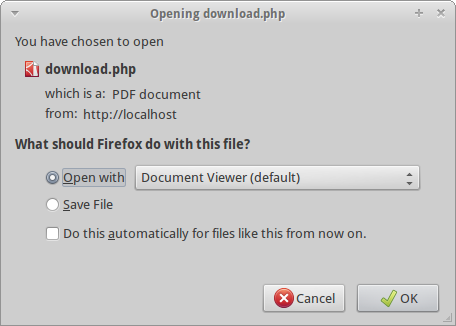
The next menu displays the choices available for output, by default GeoMoose allows a composite Raster Image, a HTML file, or a PDF. Clicking on a PDF output option will present you with a dialog similar to:
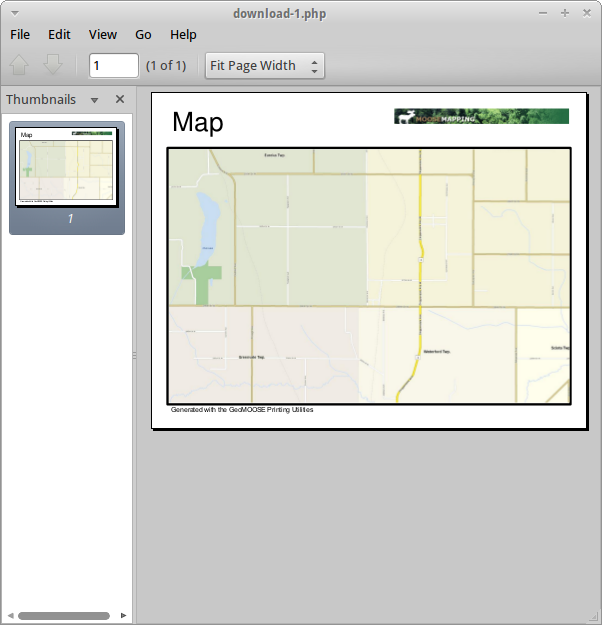
The following screenshot shows an example of a PDF output in landscape mode.