
Quantum GIS (QGIS) is a user friendly Desktop GIS client which lets you visualize, manage, edit, analyse data and compose printable maps.
Contents
Let’s start by opening up an existing QGIS project, and turning layers on and off.
Launch QGIS from Geospatial ‣ Desktop GIS ‣ Quantum GIS and select File ‣ Open Project... from the menu bar.
Choose QGIS-NaturalEarth-Example.qgs and press Open.
Tick the ne_10m_populated_places check box in the Layers tree.
Populated places are now displayed as many green dots:
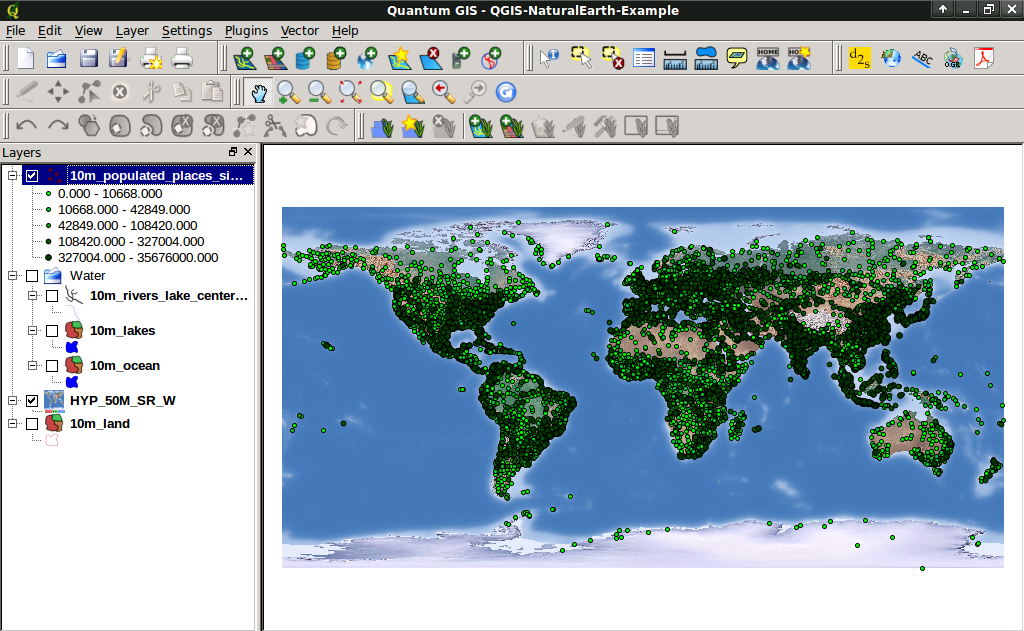
Try dragging layers up and down in the legend and see how that affects visibility of the layers below.
Have a look at the tools on the tool bar. Try panning, zooming in, and zooming back out to full extent again. Find these tools next to the hand icon. If the toolbars seem cluttered you can drag them around and turn them on and off by right clicking. You can also zoom in and out with the mouse wheel, and pan with a left-click drag.
Now let’s try customising the style of the map.
Let’s now create a new QGIS project and load our own data.
Let’s now include a layer from a Postgres database.
In the layer list on the left, untick the ne_10m_admin_0_countries visibility check box to temporarily hide it.
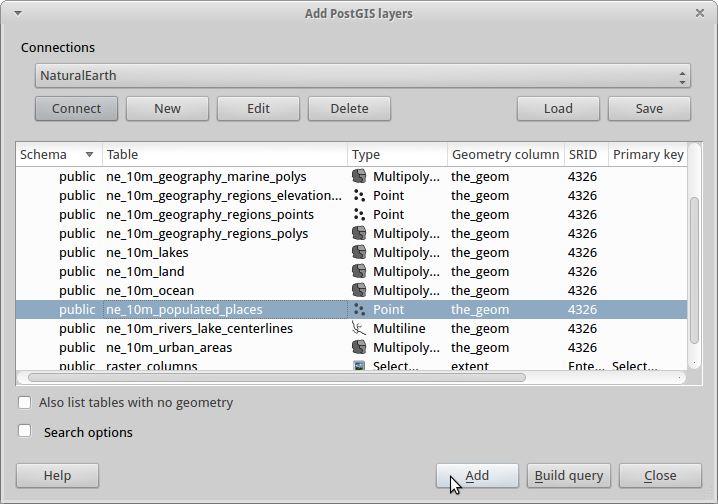
Choose Layer ‣ Add PostGIS Layers....
Select the “Natural Earth” connection and press Connect.
Select ne_10_populated_places and click Add.
Zoom in on the United States using the mouse wheel and left-click drag to navigate.
Right click on ne_10m_populated_places in the layer list to get a context menu, then select Properties.
Let’s represent one of the database attributes in the data as a bubble plot. In the middle of the Layer Properties window, drag the Transparency slider to 50%, press the Advanced button and select Size scale field, then choose elevation (it’s in about the middle of the list), and finally set the symbol Size scaling to 0.01. Then click Ok.
You can then click on the query button on the toolbar (cursor arrow with a blue “i”) and then on the map canvas bubbles to view information about the individual cities.
There have been many plugins written for QGIS which extend QGIS’s core functionality. One of the more powerful is the GRASS plugin, which taps into the hundreds of geospatial processing modules available from GRASS GIS.
Clear the slate with File ‣ New Project.
Choose Plugins ‣ Manage Plugins, then scroll down or type grass into the Filter box, and select the GRASS plugin.
Connect to an existing GRASS workspace with Plugins ‣ GRASS ‣ Open mapset.
Within the central GRASS data base are a number of sample datasets. We’ll load the North Carolina location, and the user1 mapset within it. Choose the nc_basic_smp Location and user1 working mapset, then click Ok.
To add a map to the QGIS layer list, choose Plugins ‣ GRASS ‣ Add GRASS raster layer.
In the PERMANENT mapset select the elevation_shade map and click Ok.
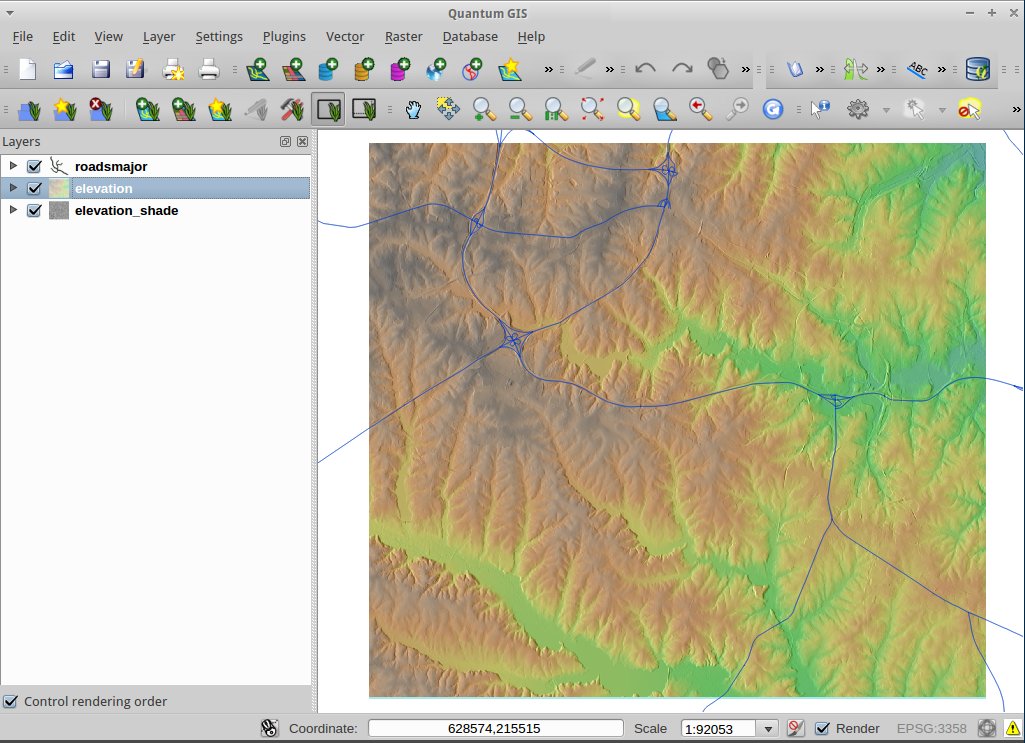
Add another GRASS raster layer, this time the elevation map from the PERMANENT mapset.
To add a vector map, choose Plugins ‣ GRASS ‣ Add GRASS vector layer.
The plugin also gives you access to many of the powerful GRASS analysis modules and visualization tools:
Another major plugin for QGIS which opens the door to a large family of processing tools is the SEXTANTE Toolbox. It acts as a standardized wrapper around a number of other sets to tools.
Open the Terminal Emulator from the Xubutu Applications ‣ Accessories menu.
Cut and paste the following commands into the Terminal window to create a working copy of the OSM data in the home directory:
cp data/osm/feature_city_CBD.osm.bz2 .
bzip2 -d feature_city_CBD.osm.bz2
In QGIS, choose File ‣ New Project. If you had the SEXTANTE Toolbox open you might want to close it.
Choose Plugins ‣ Manage Plugins.
Scroll down or type open into the Filter box and select the OpenStreetMap plugin. Then click Ok.
Choose Web ‣ OpenStreetMap ‣ Load OSM from file.
Click on the ”...” button and select the feature_city_CBD.osm file you just copied into the home directory.
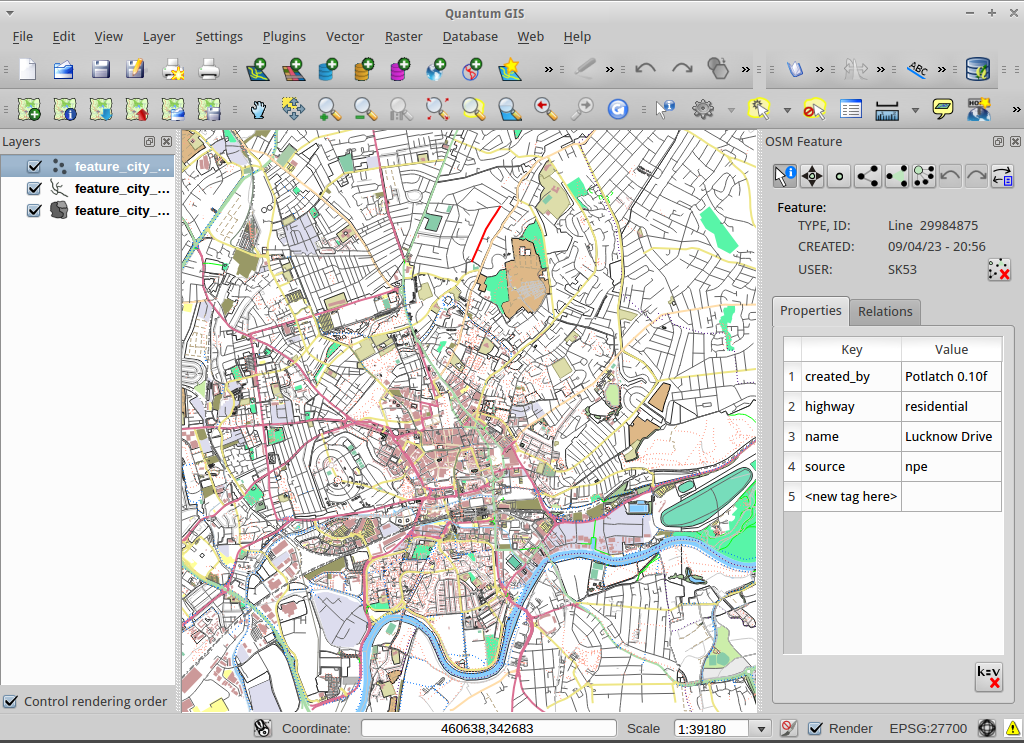
Tick the name, highway, and amenity check boxes.
Choose Medium scale rendering, then click Ok.
You can now explore this rich dataset. Use the i information cursor button in the OSM Feature Manger side-toolbar to query individal map features.
Tutorials for more advanced features of QGIS are collected as OSGeo-Live QGIS tutorials.
To learn more about QGIS, a good starting point is the Documentation page on the QGIS homepage.
A Gentle Introduction to GIS [1] eBook and the QGIS User Guide [2] are also included on OSGeo-Live.