uDig (User Friendly Internet Desktop GIS), is a GIS Desktop client for editing and viewing GeoSpatial data.
This Quick Start describes how to:
- load a map layers from a shapefile and Web Map Service (WMS)
- use the standard map tools
- apply colour to map features using styling
Contents
If you have any difficulties, or are running uDig please review the Running uDig reference page.
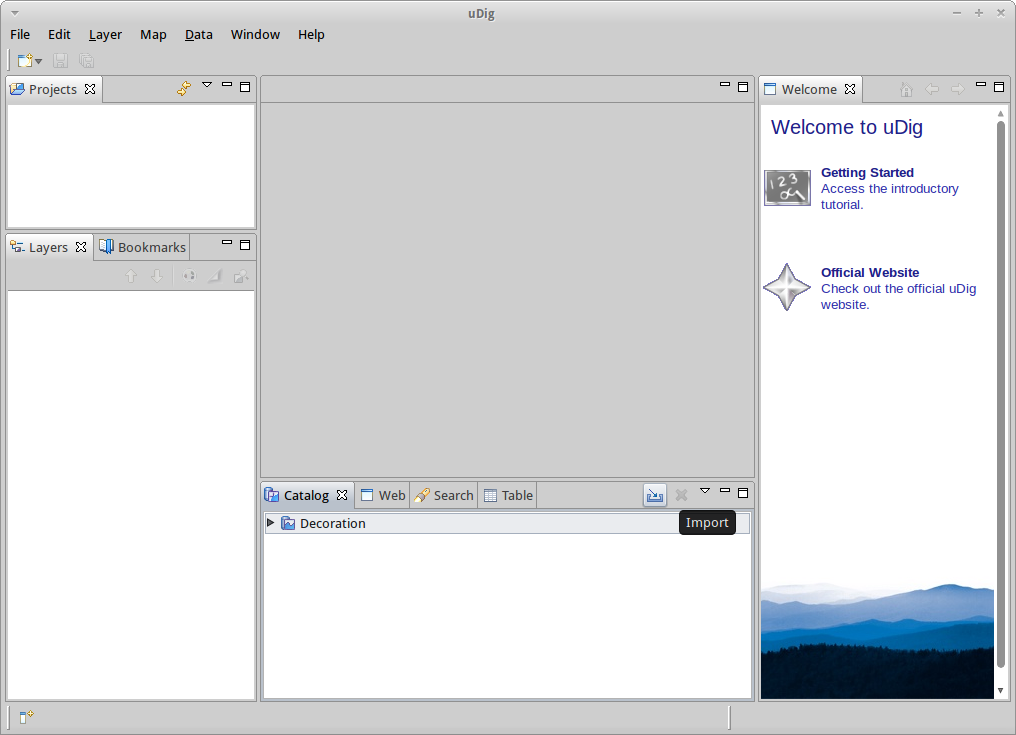
You can return to the Welcome view at any time by selecting the Help ‣ Welcome from the menu bar.
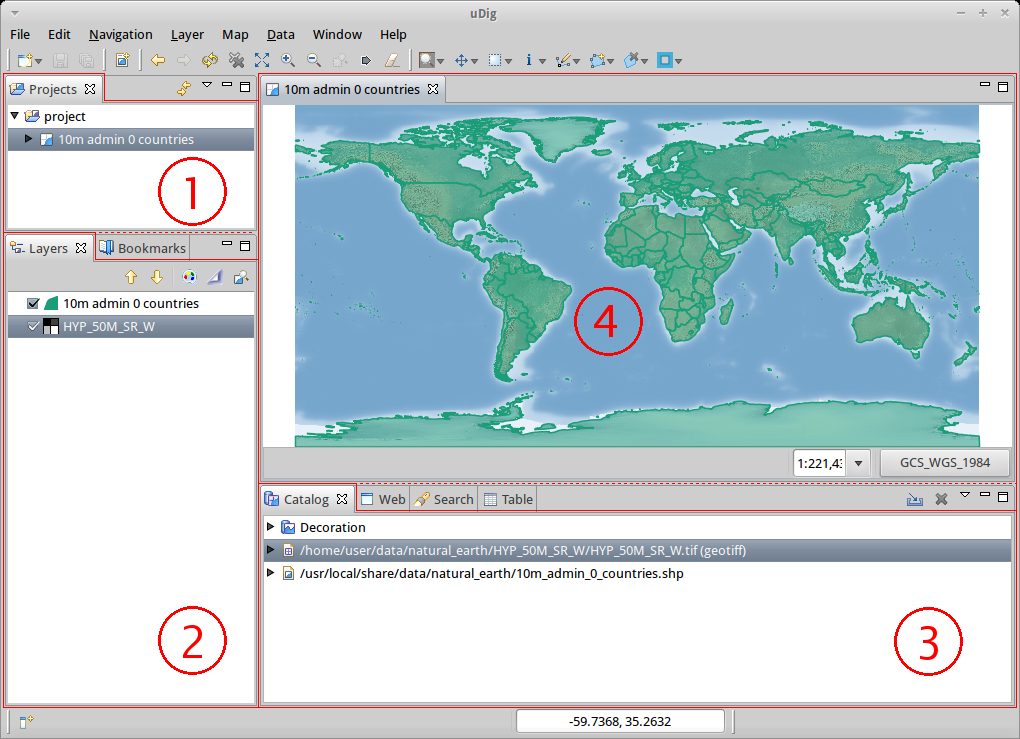
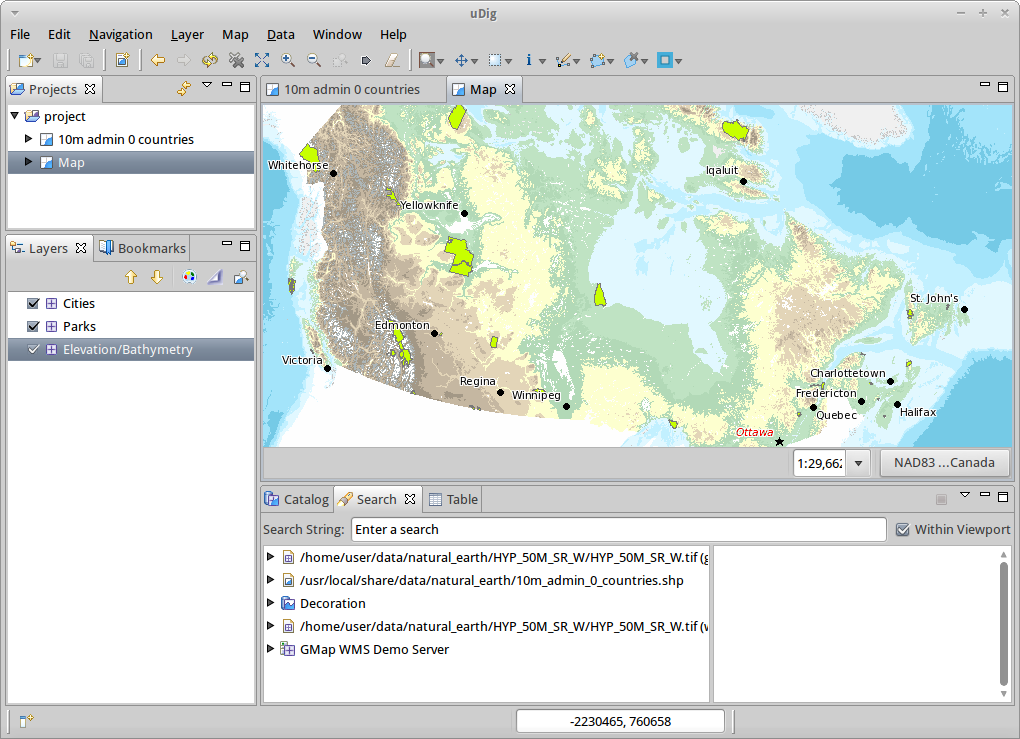
The Workbench window offers multiple Editors (each showing a Map) and supporting Views (offering information about the current Map).
Shown above is a typical uDig session with the
- Layers view (1),
- Projects view (2),
- Catalog view (3) and
- Map editor (4).
These views will be described further as we demonstrate their use.
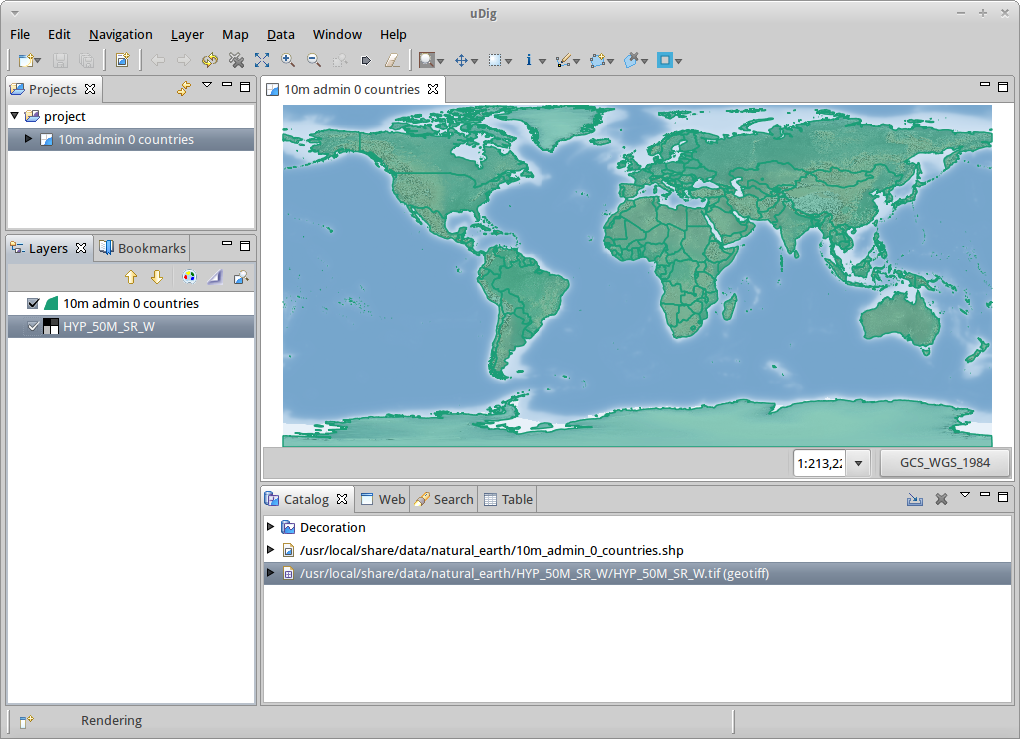
To start out with we are going to load some of the sample data included on the DVD.
Note
One of the most common questions asked when uDig is considered for an organization is how much memory the application uses. Unlike most GIS applications uDig can get by with a fixed amount of memory. The above shapefile is not loaded into memory, we have a policy of keeping data on disk and drawing data like this shapefile onto the screen as needed.
Tip
You can also drag and drop shapefiles directly into the uDig application!
You can control where in the world the Map Editor is looking by using the navigation tools in the tool bar along the top of the screen.
 Zoom tool is available by default
 Pan tool can be used to scroll around your map with out changing scale.
 Show All, can be used to return to the full extents at any time
 Zoom In and
  Zoom Out can be used to change the scale by a fixed amount.
 and Forward
  in the menu bar to cycle though previously
visited locations.
in the menu bar to cycle though previously
visited locations.Tip
Most tools allow you to Pan by holding the center button and control the scale using the scroll wheel.
One of the reasons to use an application like uDig is to access all the great free geospatial information available on the web. This section covers the use of Web Map Servers which make available layers of information that you can mix into your own maps.
Note
If you are not connected to the Internet run Geospatial ‣ Web Services ‣ GeoServer ‣ Start GeoServer for a local WMS. The script will open a page with a “Service Capabilities” section and two links for WMS Services you can drag into your empty map.
Tip
You can also connect to Web Map Servers using the Add Data (Layer ‣ Add...) Wizard for Drag and Drop.
Select File ‣ New ‣ New Map from the menu bar
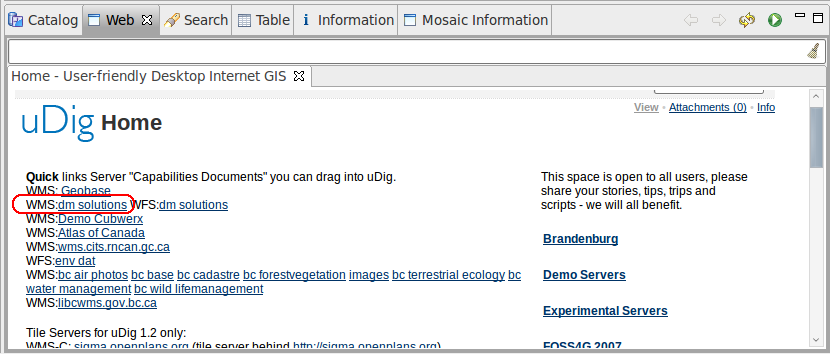
Change to the Web view, click on the tab next to the Catalog view to reveal the Web view.
Click on the link WMS:dm solutions link
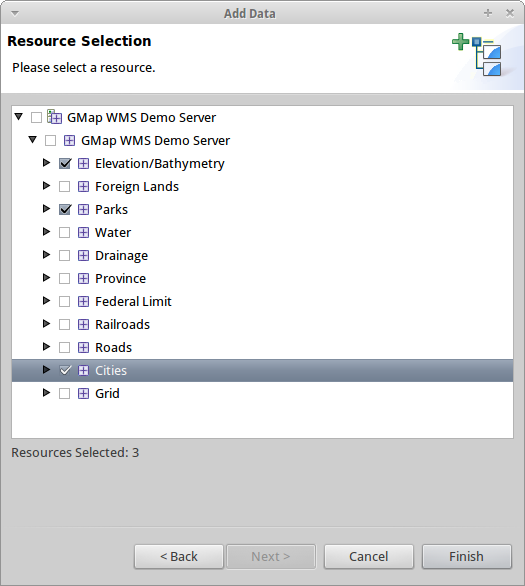
From the Resource Selection page we are going to choose the following layers:
Elevation/Bathymetry
Parks
Cities
Press Finish to add these layers to your map
Use the Zoom Tool to move closer to one of the Parks
Switch to the  Info Tool and click on one the parks to learn more about it
Tip
You can switch between the zoom and info tools by pressing Z and I on the keyboard.
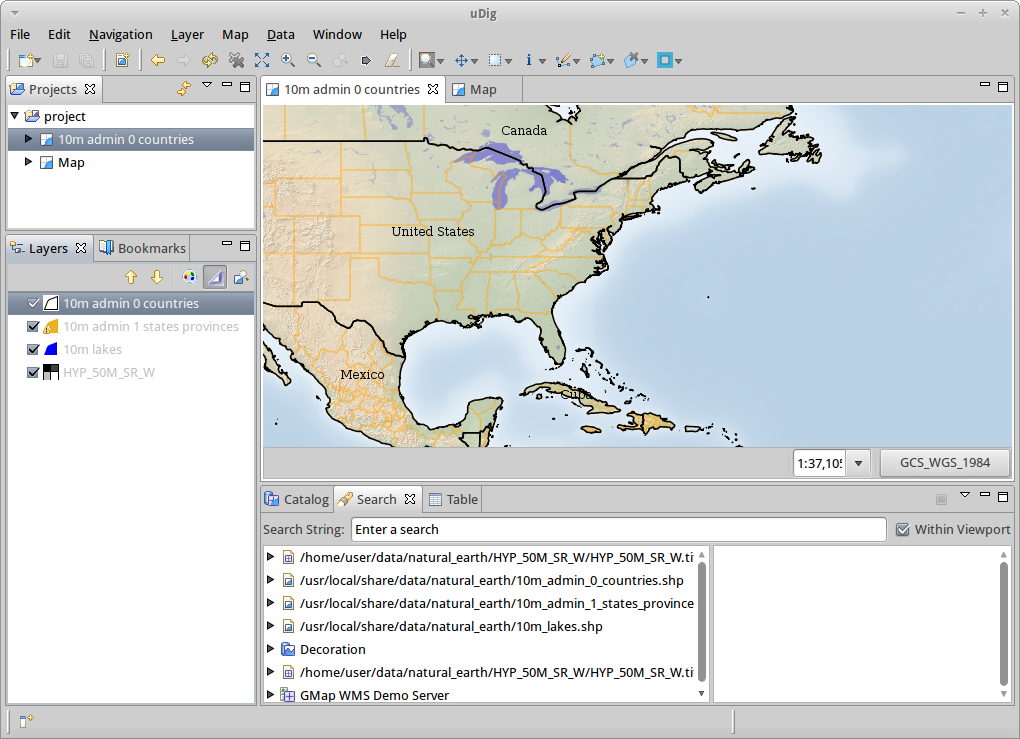
Select the project > 10m admin 0 countries, you can double click to open this Map, or Right Click and choose Open Map
Select the countries layer in the Layer view
Open up the Style Editor by right clicking on 10m admin 0 countries layer and choosing Change Style
We are going to change a few things about how countries are displayed
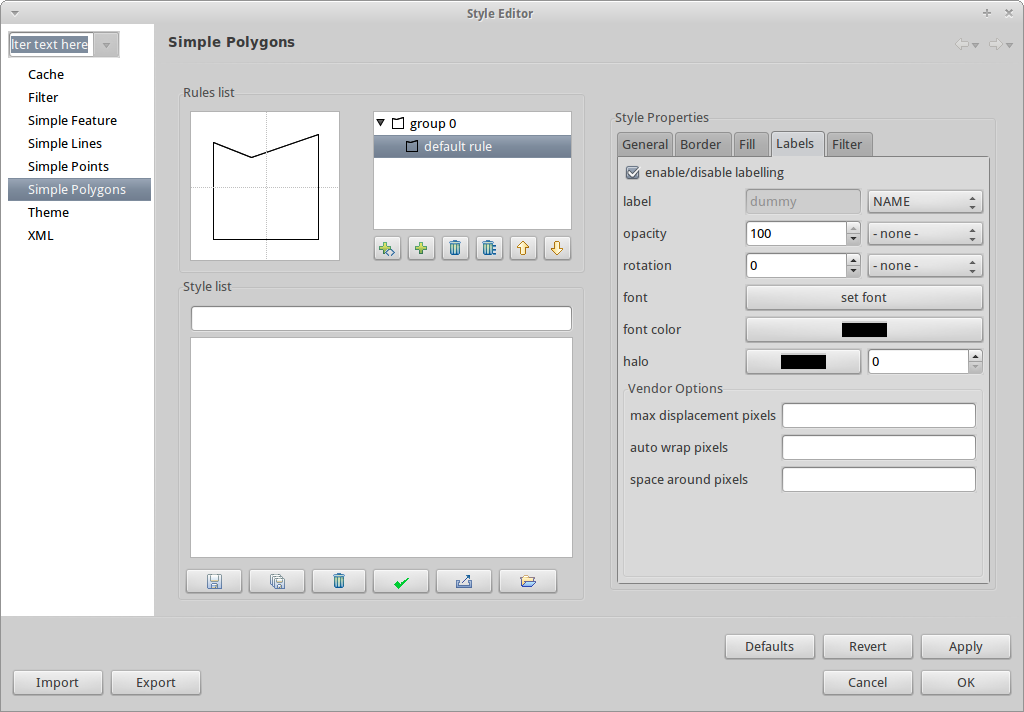
Press Apply to see what this looks like on your Map, the Layer view will also be updated to reflect the current style
When you are happy with the result you can press Close to dismiss the dialog
Note
Some files include style settings. The Style definition can be found in files with the *.sld extension. The name itself should be equal to the file containing the data. If such a Styled Layer Description (SLD) file exists, the style will be applied automatically.
Sometimes it is a bit hard to see what is going on with layer providing much details. To get focused on the task you like to work on, you can choose Map ‣ Mylar from the menu bar. Using the Layer view select different layers in turn to see the effect. You can turn off this effect at any time using Map ‣ Mylar from the menu bar.
Here are some additional challenges for you to try:
This is only the first step on the road to using uDig. There is a lot more great material (and ability) left for you to discover in our walkthrough documents.
Walkthrough 1
Try out the use of PostGIS, extract data from a Web Feature Server and explore the use of Themes with our powerful Color Brewer technology.
/usr/local/share/udig/udig-docs/uDigWalkthrough 1.pdf
Walkthrough 2 - Learn how to create shapefiles and use the Edit tools to manipulate feature data, covers the installation of GeoServer and editing with a Web Feature Server.
Available on http://udig.refractions.net/